EcoDATE Tutorial: Cone Production Data Case Study
This tutorial explains how to use the EcoDATE tool to explore the distribution patterns and temporal trends in a long-term ecological data set. The process can be broken up into three main steps: (1) import and configure data, (2) explore data with the multiple histograms views, and (3) explore data with the time-series line charts.

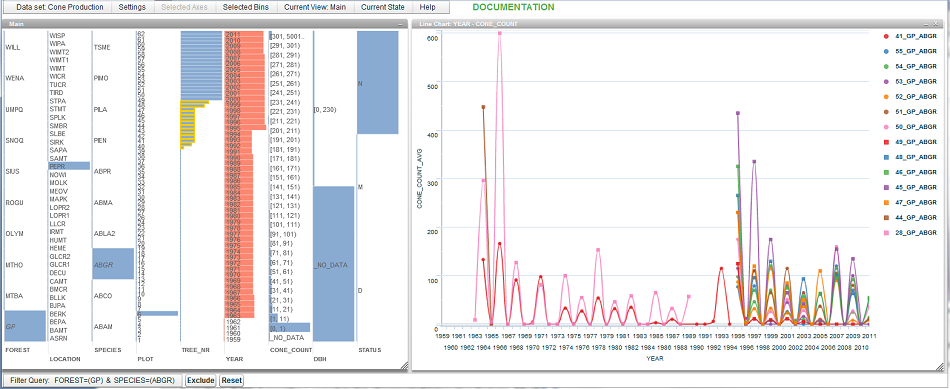
Figure 1: The EcoDATE interface for the cone production data set opened in a browser window. On the left is the multiple histograms view of a data subset. On the right is the time-series line chart showing the temporal trends of cone production among 14 individual trees.
More information on data set:
Jones, J., Franklin, J. 2012. Cone production of upper slope conifers in the Cascade Range of Oregon and Washington, 1962 to present. LTER. Forest Science Data Bank, Corvallis, OR. [Database] Link: http://andrewsforest.oregonstate.edu/data/abstract.cfm?dbcode=TV019
Additional Visualization Examples
Visualization of the Stream Chemistry Data: http://purl.oclc.org/ecodate/chemistry
Johnson, S., R. Fredriksen. 2012. Stream chemistry concentrations and fluxes using proportional sampling in the Andrews Experimental Forest, 1968 to present. Long-Term Ecological Research. Forest Science Data Bank, Corvallis, OR. http://andrewsforest.oregonstate.edu/data/abstract.cfm?dbcode=CF002
Visualization of the Forest Structure Data: http://purl.oclc.org/ecodate/forest
Harmon, M., J. Franklin. 2012. Tree growth and mortality measurements in long-term permanent vegetation plots in the Pacific Northwest (LTER Reference Stands). Long-Term Ecological Research. Forest Science Data Bank, Corvallis, OR. http://andrewsforest.oregonstate.edu/data/abstract.cfm?dbcode=TV010